IT4SE Projects and Related Projects
This section covers projects of the IT4SE project as well as related existing projects of the project partners.
Overview:
- Security Architecture for Protecting Energy-related Applications in Building Automation Systems
- Covert and Side Channels in Building Automation Systems
- USEM: Ubiquitous Smart Energy Management
- HASI (Home Analytical System Interface) -- Towards the Energy-Aware and Energy-Efficient User
- Smart Living Project
- Virtual Power Plant Simulator
- Interactive micro grid simulator
- Weather project of Augsburg University of Applied Sciences (Prof. Beck)
- IDSLM project of the University of Waikato
Secure Architecture for Protecting Energy-related Applications in BAS
We developed a secure software architecture abstracting from low-level building automation hardware access and providing an unified application programming interface (UAPI). We designed and implemented an architecture with a special focus on energy monitoring and energy awareness.
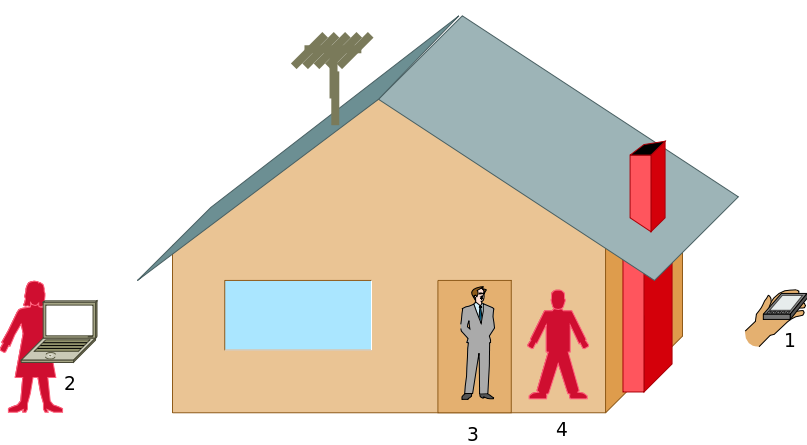
The architecture's design is related to Fogg's design mantra (cf. Sect. 'HASI (Home Analytical System Interface) -- Towards the Energy-Aware and Energy-Efficient User') and aims to change the inhabitant's energy consumption behaviour using triggers. The architecture abstracts low-level security problems and prevents direct low-level BAS access. Additionally, the architecture contributes to the privacy of inhabitants.
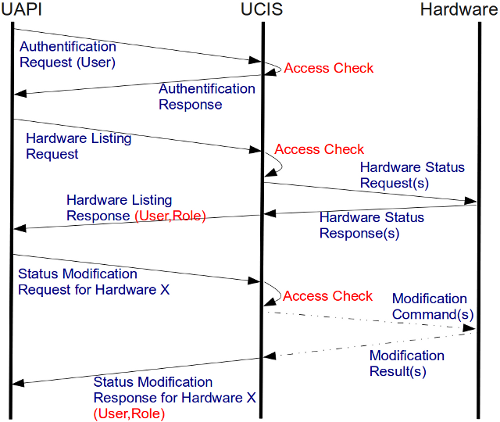
Our architecture serves as a middleware used by applications. Applications are forced to access the middleware, i.e. direct low-level BAS access is not granted. The architecture forwards/rejects low-level requests based on a user's role/permissions. For the communication between a user's application and the middleware (UAPI) layer, we developed a communication protocol shown in Fig. 2.
The related paper [1] can be found in the proceedings of the ISABEL conference and the poster can be downloaded here.
Covert Channels in Building Automation Systems
Covert channels are unforeseen communication channels which can, similar to side channels, be used to leak confidential information. In the context of building automation, a side channel leaks information about states in a building (e.g., the presence of a person in a given room or the temperature in a room). Such information can be used to observe inhabitants/employees [1]. A covert channel additionally adds the idea to actively send information to the side channel concept (a side channel leaks information unintentionally).
In [2], we evaluated the possibility to embed covert channels in building automation protocols and exemplified our ideas in the BACnet protocol. Additionally, we discussed prevention means for the presented covert channels by introducing a multilevel security architecture in the BAS network.
[2] Wendzel, S., Kahler, B., Rist, T.: Covert Channels and their Prevention in Building Automation Protocols -- A Prototype Exemplified Using BACnet, 2nd Workshop on Security of Systems and Software Resiliency, Besançon, France, 2012 (to appear).
USEM: Ubiquitous Smart Energy Management
Development of an Architecture of a Ubiquitous Smart Energy Management System for Residential Homes:
HASI (Home Analytical System Interface) -- Towards the Energy-Aware and Energy-Efficient User
While the need for more efficient use of energy is commonly accepted, for the individual it is often difficult to act accordingly. Firstly, there may be an information lack about the energy costs caused by a certain activity or a neglected activity, such as leaving on lights or electrical appliances in stand-by mode. So-called eMetering devices aim at filling this information gap. Mounted between a socket outlet and an electrical appliance they measure power consumption and may translate consumption values into monetary costs. However, the provision of information about energy consumption alone does not necessarily imply acting. Rather, assisting people in actually changing their behaviours is a much harder challenge.
The question of how to utilize computer technology to assist people in changing behaviours, especially to get rid of bad habits, is dealt within the field of “persuasive computing”. A pioneer in this field is BJ Fogg from Stanford University who postulates the statement “Put triggers in the path of motivated people” as a design mantra for behaviour change [2]. According to Fogg’s behaviour model, for a behaviour change to happen three factors must coincide: the person must be motivated in principle, a trigger must be present that just-in-time reminds the user to do the right thing instantly, and he/she must be able to act. Adopting this model for the purpose to increase the community of energy-efficient users means:
- 1.motivation: strengthen a user’s motivation to save energy and keep her/him motivated;
- 2.trigger: identify opportunities at which the user should perform actions that contribute to efficient energy use, and provide appropriate notifications as triggers;
- 3.enabling: set-up of a technical infrastructure and usable services as enabling means for the execution of actions as easy as possible. Our projects HASI, USEM, and Smart Living have in common that all of them address these three facets in one way or another, however, each project has its own focus.
Defining an Enabling Infrastructure for Information and Assistance Services
An enabling infrastructure for information and assistance services must handle the acquisition and storage of consumption data on the one hand, and should allow for remote control of appliances on the other hand.
While metering devices as well as home automation hardware are available on the market there is the problem of non-interoperability of hardware components produced by different vendors. For instance, in our projects HASI and USEM we rely on the CurrentCost1 system by CurrentCost Ltd. and HomeMatic hardware by eq32. Current Cost is devised as a measuring system only, i.e., it does not provide means to control appliances, e.g., to switch them on and off. HomeMatic on the other hand provides actuators for building automation and sensors able to inform inhabitants about the status of different components in their house (e.g. whether the windows are open or closed) but is unable to check energy consumption. Both systems are sold as stand-alone solutions which means that the hardware components are not able to exchange data. Even worse, each system uses an proprietary protocol and data format. This is unpractical when such systems are to provide the basis for higher-level services that shall assist users in saving energy.
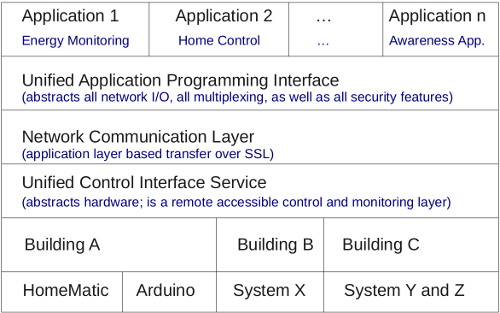
To provide interoperability between non-interoperable devices, we developed a multi-layer software architecture for home automation. This software architecture contains an unification service (cf. Fig. 1). All building automation and monitoring on the lower level (i.e. hardware access and event logging) is under control of a network service used by clients. On top of the hardware layer is a service that abstract from all hardware-specific characteristics, and provides a secure network interface for the communication between clients and the home automation server. Our architecture additionally contains an application programming interface (API), designed to allow developers to access the same interface for multi-purpose applications, such as energy monitoring applications, awareness applications, and building management applications. Using this approach, we were able to achieve both targets, inter-operability and security for building automation.
While the projects HASI and USEM conceptually share the layered architecture, each project followed an own implementation strategy.
HASI was implemented during the summer term 2011 at Augsburg University of Applied Sciences. It runs on a lightweight open source system (Linux and Python) and uses a MySQL database as a backend. It is able to run on small-scale, low energy consuming hardware (e.g. a netbook) within a user’s home. Event notifications from sensors as well as power consumption measurements are logged in the database and are made accessible as a web-resource for other services. A test installation of HASI including sensors for power consumption, temperature and state indicators for windows and doors has been set-up at an apartment and run from May-July 2011. HASI is now installed in a office room at the faculty of computer science and serves as a test-bed for further development.
The project USEM was conducted at the University of Waikato with guest researchers from Augsburg University between March and September 2011. The USEM communication infrastructure relies on the JSON-RPC technology and enables a two-way communication between event and data recording and client applications. The advantage of this implementation approach is that client applications registers with the infrastructure to receive certain event notifications rather than have to continuously poll for new information updates, cf. [3] for more details.
Both implementations provide uniform access to sensor data and enable remote control of vendor-specific subsystems via a web browser or a smartphone app. A detailed comparison of the pros and cons of the two implementations will be part of our future work.
Putting Triggers in the Path of Motivated People
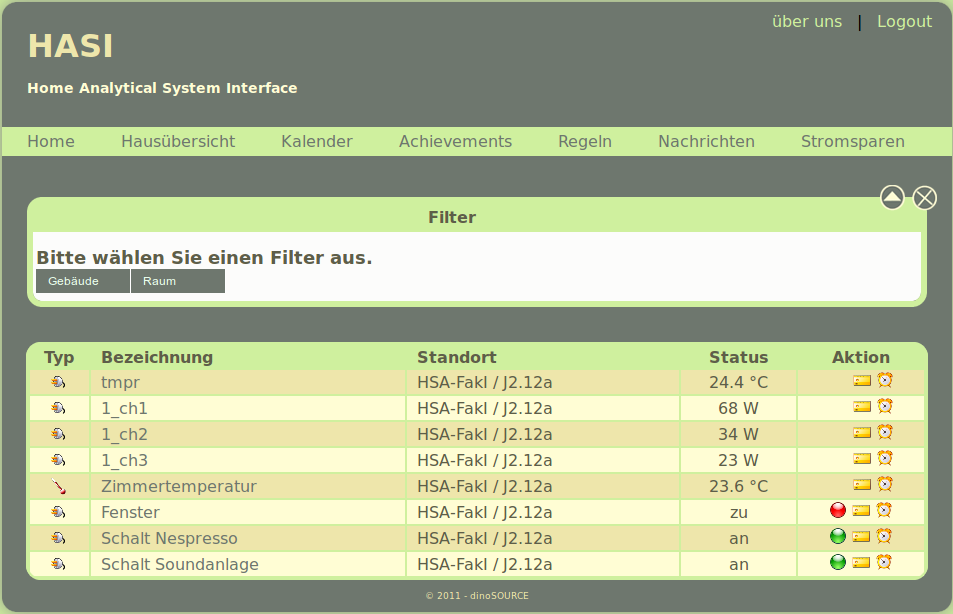
Given the task of informing users about their energy consumption one might at first think of designated dashboard displays or data browser which allow users to access consumption values on demand. In deed, in our projects HASI, USEM and Smart Living a user is given the option to browse through sensor data, e.g., using a classical hierarchical menu structure. For instance, Fig. 2 shows a snapshot taking from the HASI web interface which allows browsing through sensor status information.
The major problem with such an approach is, however, that it assumes an always actively involved user -which is certainly a too strong assumption given that users are concerned with other things than energy saving, too. Therefore, a different and perhaps more promising strategy is to follow Fogg’s design mantra and to seek for opportunities where to put triggers in the path of motivated people.
In the case of HASI and USEM opportunities are primarily applications that are almost daily used by an individual and run a computer or a smart phone with internet access, such as a calendar or diary system, or a social network. The basic idea is to hook information on energy consumption and advice to reduce consumption into such applications.
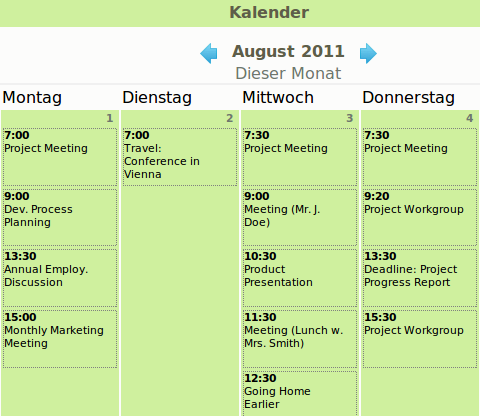
As an example, the HASI project developed an augmented calendar system in which a user can associate certain time slots with notifications relevant to energy use. A standard use case is the addition of a new appointment after regular business hours which implies leaving for home later. In this case the HASI calendar system will ask the user if the heating system shall be switched on later, too. Of course, a user could achieve the same effect with two different applications, i.e., a conventional calendar system and a separate remote home-control application. However, the question is of whether he/she would do so. The HASI solution at least has the advantage that it minimises the user’s distraction and extra efforts for acting. HASI provides relevant information just-in-time and execution of the energy-saving action is just a click away from the user’s primary path, i.e., entering a further appointment.
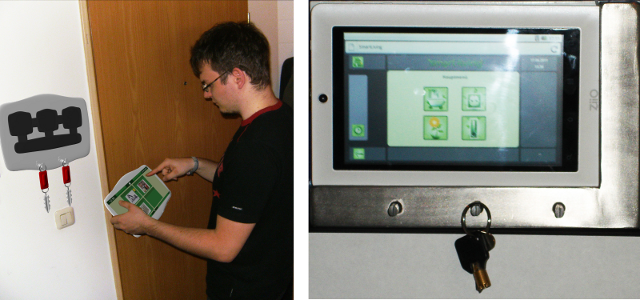
The Smart Living project took another approach to strengthen a user’s energy awareness. This project designed an electronic key-holder panel which is assumed to be placed next to the entrance door of a home or an apartment. When a key is removed from its hook, the smart leaving system assumes that the inhabitant is about leaving. The system then quickly checks sensor status information and informs the habitant about possibly unclosed windows, left on appliances and lights. Some paper mock-ups for early usability testing as well as a functional proof-of-concept prototype have been built during the project (cf. Fig. 4). In this example the advise to “put a trigger into a person’s path” has been almost taken literally. However, feedback on the prototype suggests that such a reminder service is likely to be appreciated even by users who are less motivated to save energy.
Further outcomes of the Smart Living project include Smart Garden and Smart Living tv. Smart Garden is a dynamically changing picture of a garden. It is designed as an ambient display which is sensitive to a user’s measured energy consumption. If the overall consumption is below average the garden starts flourishing, while consumption above average results in a withering garden (cf. Fig. 5). The Smart Garden is used as a background image for the key-holder panel but may be displayed in a digital photo frame, too.

The idea behind Samrt Living tv is to substitute in an ordinary tv programme commercials by automatically generated personalized info clips about a persons energy consumption. The interesting point here is that unsolicited commercials are usually perceived as annoying obstacles in a user’s path towards viewing news or a movie. One reason may be lack of relevance for a particular viewer. Replacing such a commercial by a personalized information clip may be less annoying if not an acceptable means to increase a user’s energy awareness. So far, for illustration only a sample clip has been manually created and spliced into a recorded tv programme using a video editing tool. Automated clip generation and real-time programme manipulation (e.g. using the open source VDR software) has not yet been implemented.
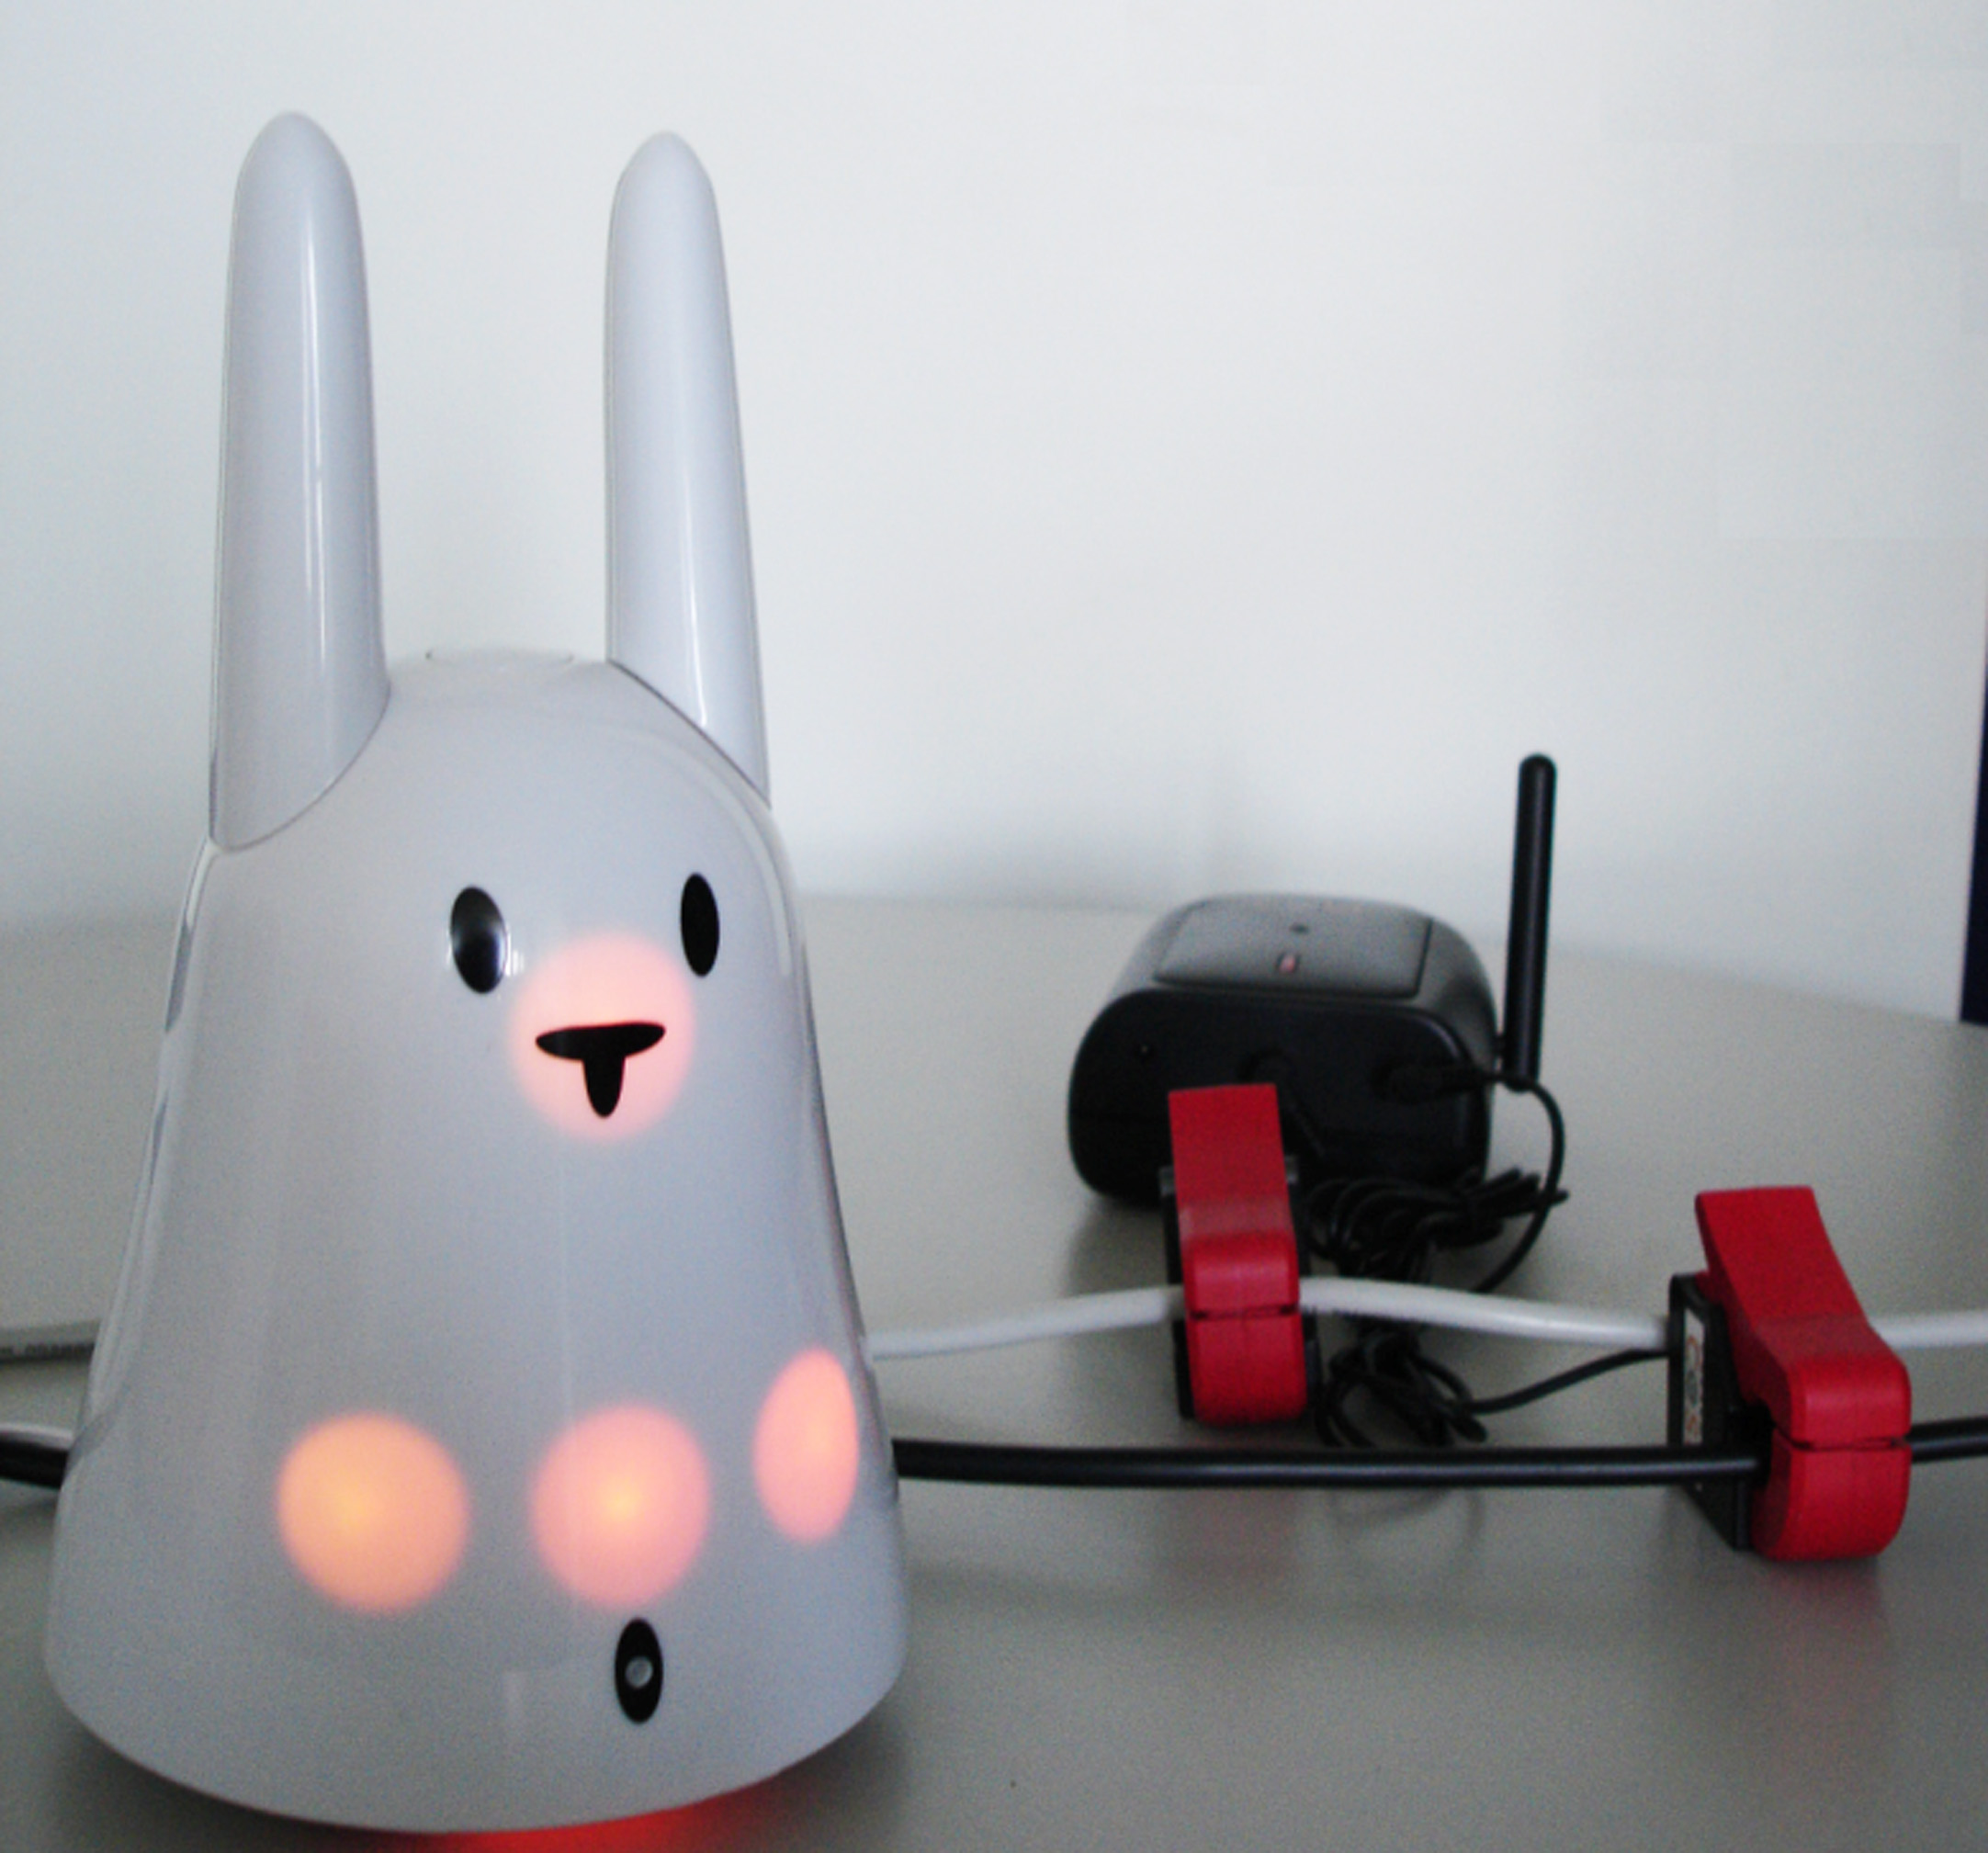
Finally, it deservers mentioning that not all of our attempts have turned out satisfactory. In an earlier stage of the HASI project we also experimented with a so-called “Nabaztag rabbit”3, a kind of an electronic pet which uses a WLAN connection for remote control and the reception of (either pre-recorded or TTS-generated) audio messages for playback (cf. Fig. 6). It was envisioned that in a users home the rabbit would verbally inform about energy-relevant events (open windows, left on lights etc.), and give advice on how to save energy. While the set-up of such an information service was technically possible on the basis of HASI’s enabling infrastructure implementation, a self-test revealed that sudden and unsolicited verbal notifications are likely to be perceived quickly as being more annoying and disturbing than useful.
project flyer (in German)
project webseite (in German, under construction)
Projektwebseite: Test System
[3] Kugler M, Reinhart F, Schlieper K, Masoodian M, Rogers B, André E, Rist T: Architecture of a Ubiquitous Smart Energy Management System for Residential Homes. In Proc. of CHINZ 2011, Hamilton, New Zealand, 2011.
Virtual Power Plant Simulator
The Virtual Power Plant Simulator has been designed as an interactive tool to support decision making on mixing renewable energy sources in a community. Users can modify the interactive bars of a chart to select a certain energy mix. Relying on records of regional weather data the simulation calculates the potential enrgy production and compares production with energy consumption.
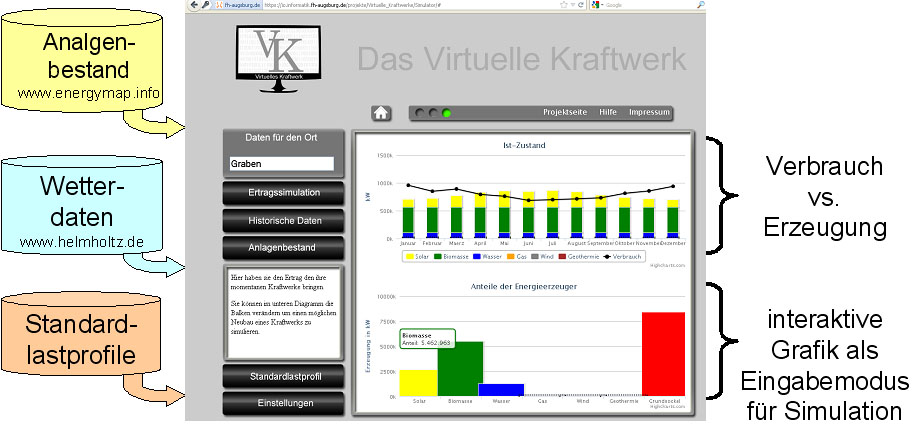
An online version of the simulator is in preparation.
Interactive micro grid simulator
Discussions with attendees of a regional climate protection conference4 revealed that there is a high demand for freely available and easily accessible tools that assist communal / urban planners and decision makers as well as private home owners in performing cost-benefit analysis’s of investments into e.g.: renewable energy generators, the set-up of self-sufficient micro grids in a neighbourhood, or insulation measures of existing buildings. The development of such tools and simulation platforms constitutes another strand of research under the IT4SE umbrella.
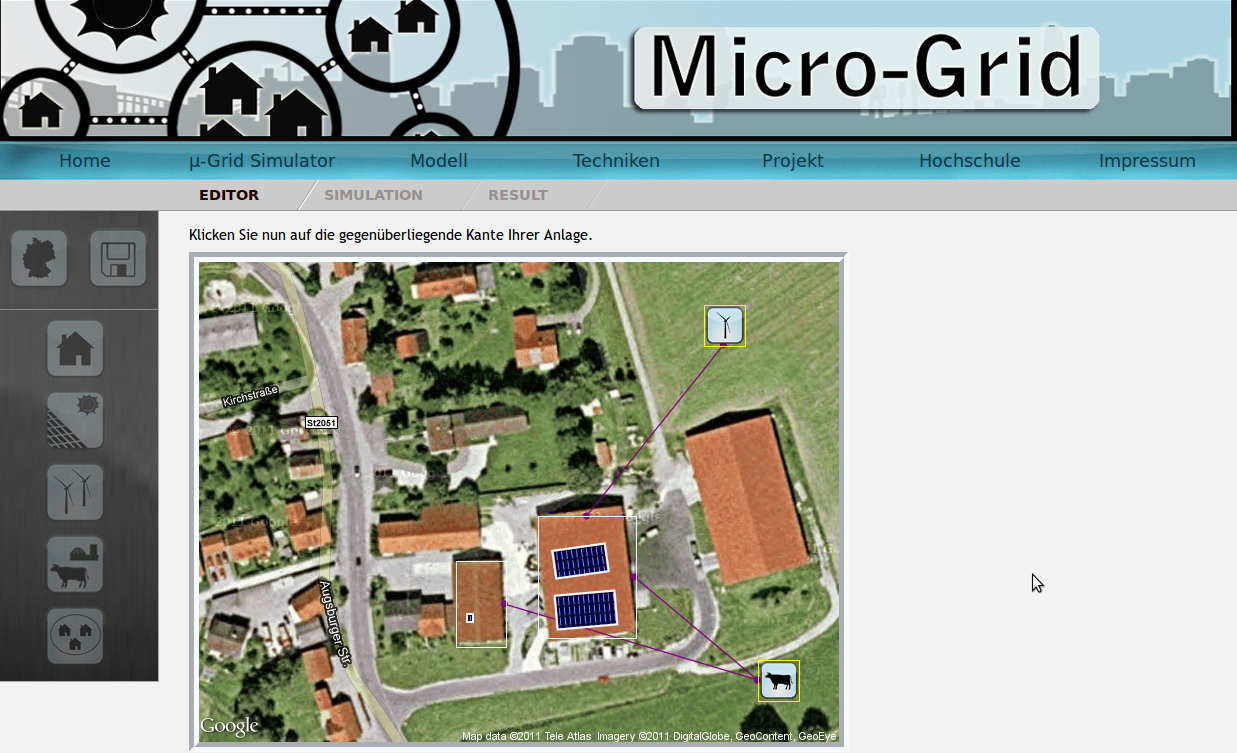
A first instance of such a tool has been developed by a forth project team. The resulting system is a web-based editing and simulation tool –called Micro-Grid Simulator– which enables its users to define hypothetical micro grids composed of renewable energy generators and then simulate energy production over a given time period based on recorded real-world weather data.
The Micro-Grid Simulator is a classical client / server application with clients running in an ordinary Java-Script enabled web-browser. The client-side software contains an interactive editing tool for the definition of generation scenarios which serve as input for simulations (cf. Fig. 7). From a user’s point of view the work-flow to define and run a simulation is as follows:
- Step 1: Using the satellite view of Google maps the user selects a region of interest adjusts the zoom level and imports the map section as background map into the Micro-Grid Simulator.
- Step 2: On the imported map the user defines objects of interest, such as buildings or backyards by drawing a rectangular frame around them. In the simulation these objects serve as energy producing and/or energy consuming entities.
- Step 3: Renewable energy generators can now be attached to defined objects. To this end, the user drag-and-drops generator symbols (i.e. solar panels, wind turbines, or biogas plants) onto defined objects. For example, as shown in Fig. 7 a user (possibly a farmer) has placed two solar panel onto the roof of his barn. In addition, he placed a wind turbine and a biogas plant on his nearby land.
- Step 4: Each object and generator is characterised by a number of specific parameters which can be entered via text-input fields or check boxes. To alter settings the user just clicks onto the object and obtains an entry form. For instance, for a solar panel the user is expected to specify size, alignment, and its efficiency ratio). Note that an object representing a home can also be associated with an average energy consumption value. This will enable the simulator to compare consumption and generation over a certain time period.
- Step 5: Optionally, different objects and their associated generators can now be interwoven into a micro grid. To this end the user draws connection lines between the objects on the map. This feature allows a user to hypothetically join up with neighbours and simulate the result of aggregated energy production. Moreover, it is possible to define several independent micro grids as input for a single simulation run.
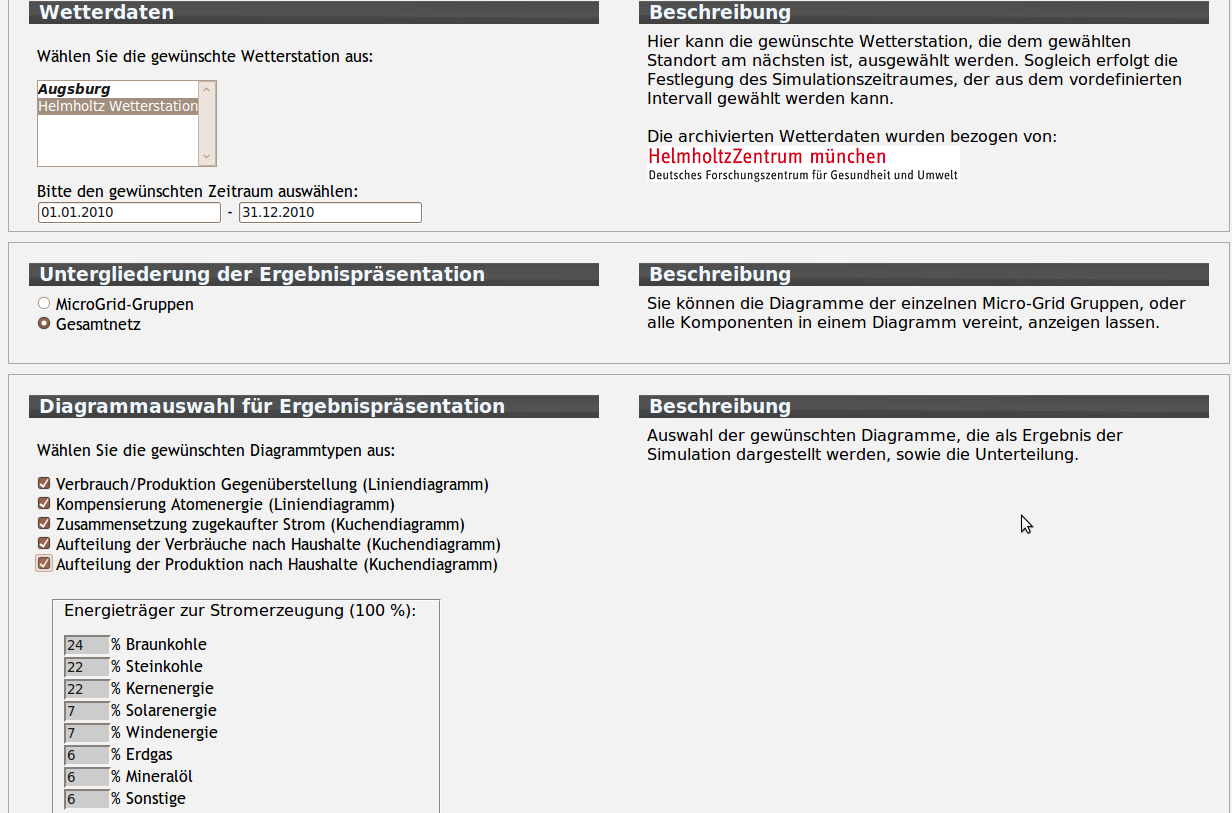
- Step 6: The simulation is based on weather data sets recorded by regional measurement stations of the Helmholtz Institute. The data sets contain minute-by-minute measurements of global solar radiation (in Watts/sqm) and average wind velocity (in m/sec). For simulator testing we gained access to weather data of the years 2005-2010 recorded at the measurement station Augsburg. A user is free to define time spans for simulation runs. This way a user can run simulations for different years and compare the results (e.g. the output of a solar panel in a rainy summer versus in a hot summer).
- Step 7: In this final set-up step the user can chose among a number of diagrams for the presentation of the simulation results. Results can be displayed as time-dependent graphs showing: (1) the balance of energy production and consumption, (2) the compensation of atom energy by renewables, and (3) the assembling of required external energy. Additionally, an aggregated overview is presented on each household-specific energy consumption and each plant-specific energy production. Fig. 8 shows the entry form for specifying a simulation period (cf. Step 7) and for display options for presentation of results.
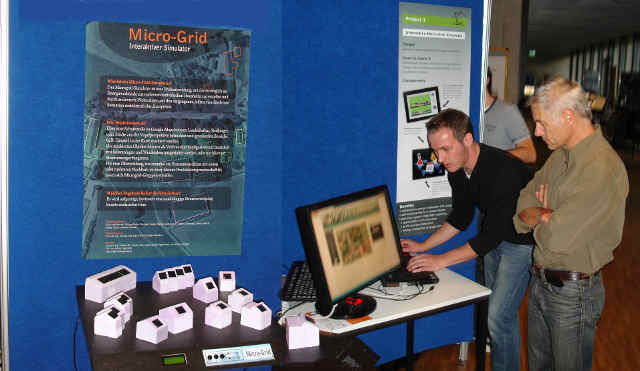
- The Micro-Grid Simulator has been exposed to the public at various occasions, including the “Forschungsforum” event at the University of Applied Sciences Augsburg in July 2011 (cf. Fig. 9). As simulations are quite resources hungry, online access to the simulator is currently restricted to registered users only due to limited resources for hosting web services on our university servers.
Projektwebseite: Microgrid.Informatik.HS-Augsburg.de
Weather project of Augsburg University of Applied Sciences
In 2009/2010 a weather data project with the aim to collect and visualize weather data was developed at Augsburg University of Applied Sciences under the leadership of Prof. Dr. Beck. The project is a cooperation with the Helmholtz Zentrum Munich and the Bavarian Environment Agency. Both project partners provide historic and/or current weather data for the project. The weather project also contains historic weather data from a University-internal weather station. The developed software visualizes and stores the weather data in a unified format.
Started as a Master's project, the project was finished due to continued development based on 3 work contracts. A member of the IT4SE project is involved in the continuing development of this weather project.
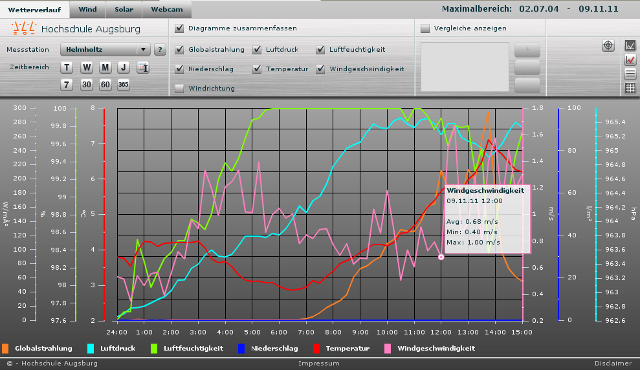
The developers are currently working on a integration of additional ceilometer data (for measuring clouds), the integration of a webcam, a integration of the webcam pictures in the websites of the Bayerische Rundfunk and different detail improvements. A new website for the project was finished in late 2010.
Website: wetter.hs-augsburg.de (in German)
IDSLM project of the University of Waikato
Significant reductions in peak domestic electricity consumption, and improvements in the efficiency of this consumption, may be achieved through informed consumer load management through a mix of automated pre-programmed and personal decisions. By closely linking demand-side management with supply-side load control and information (availability and pricing), it is contended that such provisions have the potential not only to reduce the peak domestic demands for electricity now, but allow for better integration of non-carbon based generation capacity, and slowing of the need for growth of generation capacity. This is especially important when electric vehicles are considered.
The Informed Demand-Side Load Management project (IDSLM) is exploring mechanisms that help achieve these goals. It is primarily concerned with three main areas: collection and analysis of household data including vehicle usage and electricity consumption, the development of visualisation and interaction techniques to communicate with users who are unfamiliar with electrical concepts such as power and energy, and the development of retrofit monitoring and control systems for households.
Website: www.paulmonigatti.com/projects/phd/
